POINT-OF-SALE ANALYTICS · PORTLAND

The numbers your POS won't show you.

Every point-of-sale (POS) system ships with a dashboard, and they all tell you what you sold. Very few tell you what it cost you to sell it.

WHEN YOU ARE NOT IN THE ROOM

A second account of the week.

Most of what you know about a shift you missed comes from the people who worked it. That is usually right, and it is always partial — a closing manager knows their own Friday, not the Tuesday lunch they were off for. This is the other account, assembled from what the tills, the schedule and the invoices already recorded.

What you hear

“Friday was busy. We got slammed around seven.”

What the week recorded

Friday peaked at 19:00 on $8,970, about 6% above forecast. The queue built because two of the five tables in section 12–16 were still turning from the 18:30 sitting.

What you hear

“Tuesday was quiet. Nothing out of the ordinary.”

What the week recorded

Tuesday lunch ran 18 labor hours above forecast, and has done on nine of the last fourteen days. Quiet is the pattern, not the exception.

What you hear

“The steak has been selling really well.”

What the week recorded

It has. It also earns the least of anything on the menu — margin fell 6.2 points after the supplier changed on 12 September, and the price has not moved since.

Neither account is wrong, and you want both. Only one of them saw every shift — and where something moved, it says what moved, what it cost, and what to do next.

THE GAP

Your POS counts sales. It doesn't count cost.

Sales reporting answers one question: what went out the door. It leaves the questions that decide whether the month works — what the food and labor cost together, which items earn their place on the menu, which hours are overstaffed and which are quietly losing you covers. Those numbers exist. They sit across the POS, the invoices and the schedule, and nothing joins them up.

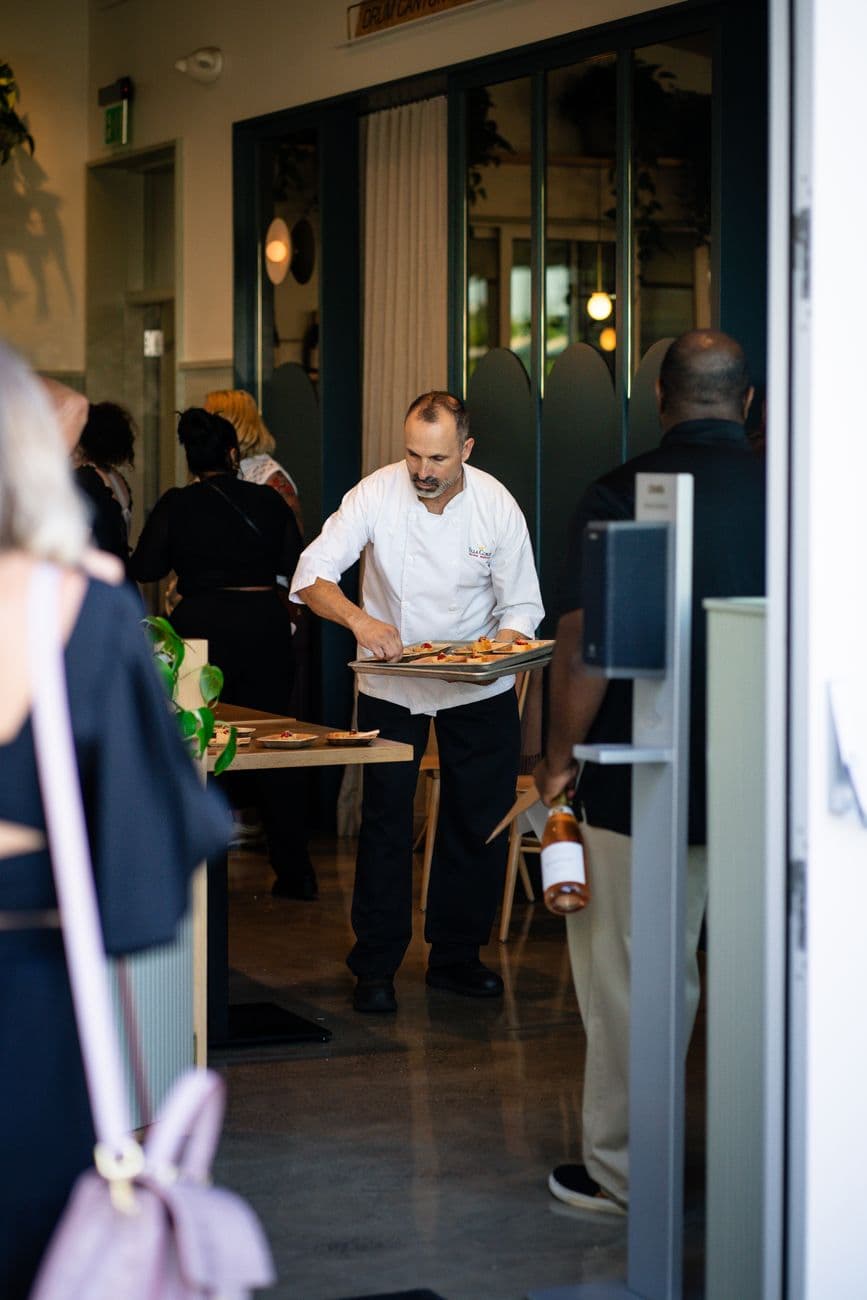
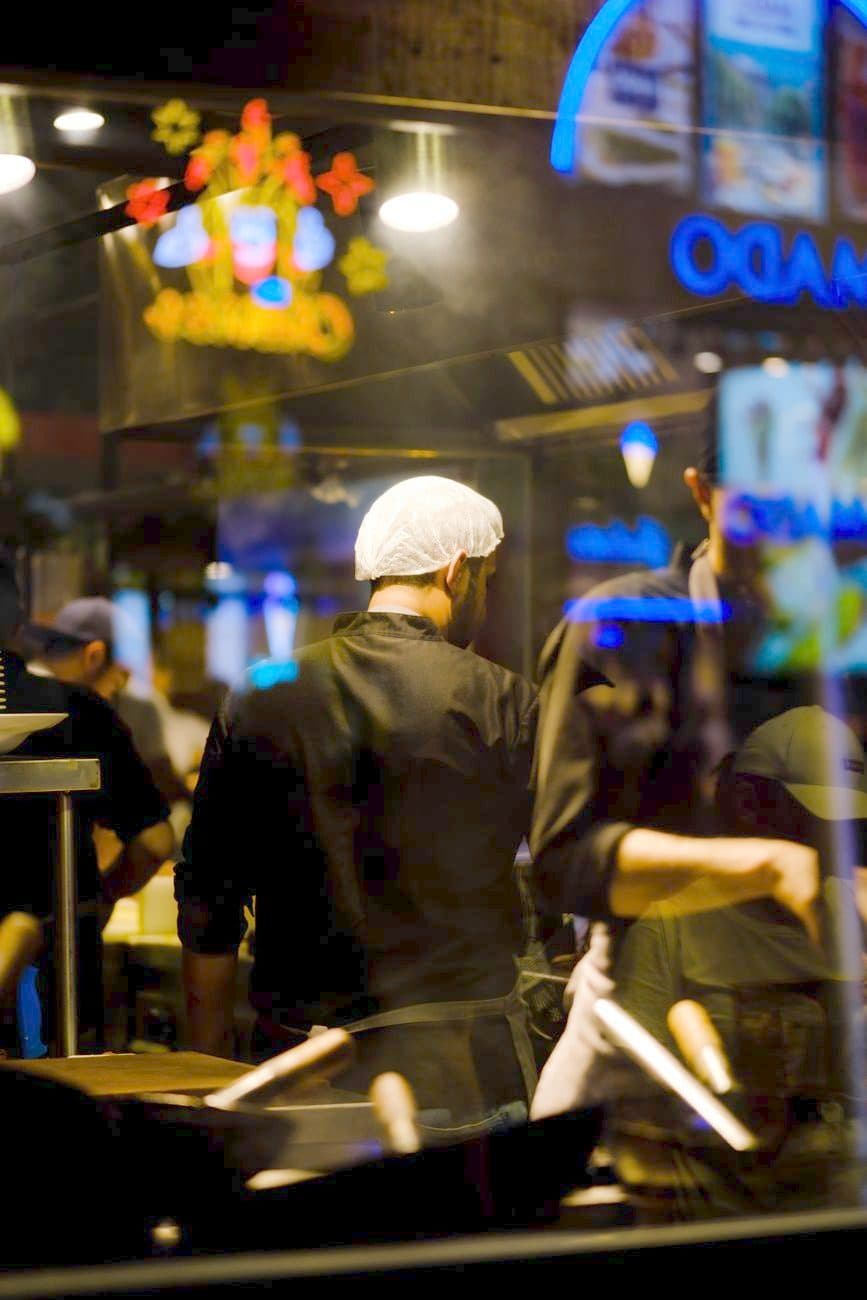
A chef working the pass in a restaurant kitchen at night

Prime cost

Food and labor together, against sales, for the period you choose rather than the one the POS defaults to.

A server carrying plates through a busy dining room

Labor by daypart

Cost as a percentage of sales, hour by hour, so an overstaffed Tuesday lunch shows up as a number instead of a feeling.

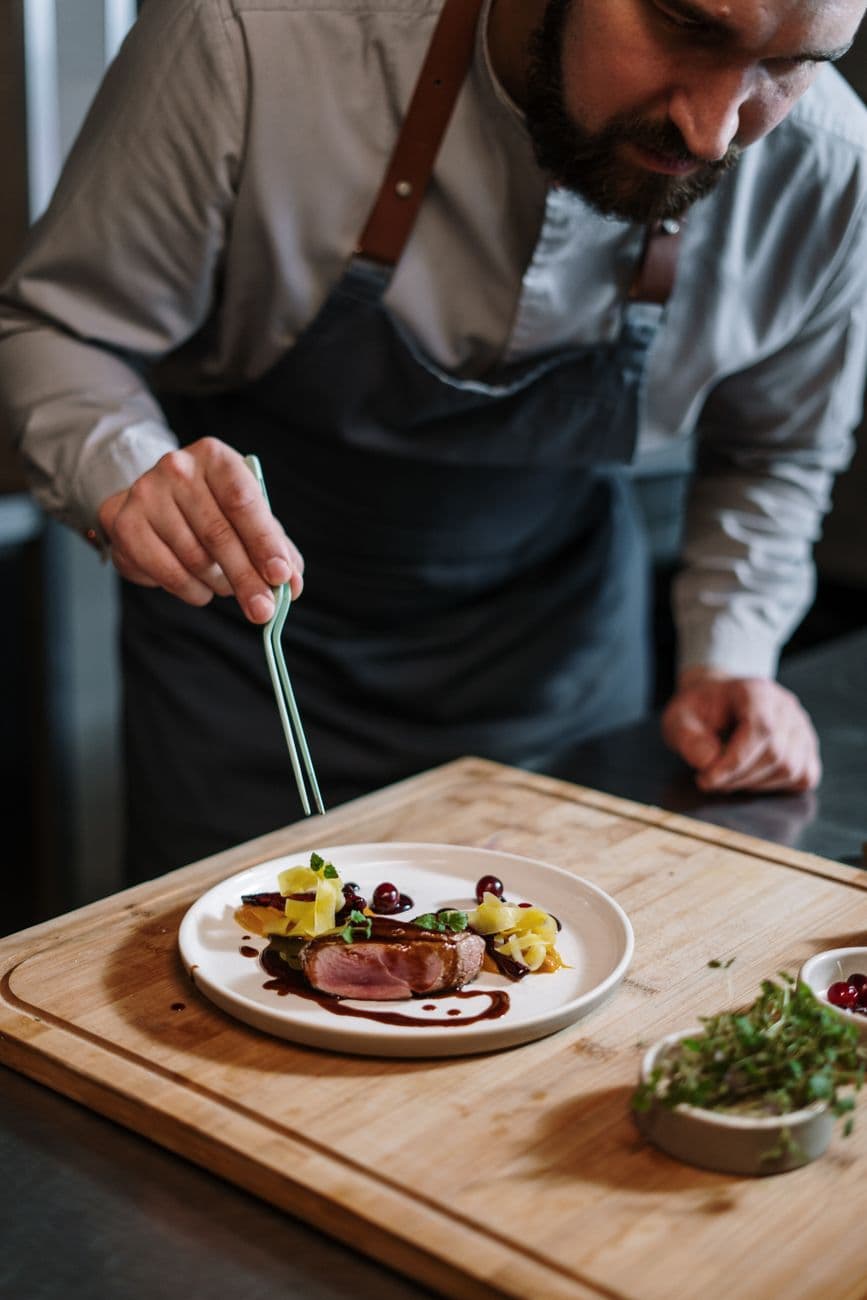
A chef plating a dish in a professional kitchen

Item-level margin

Measured against the costs you enter, so the menu can be read by what it earns rather than by what it sells.

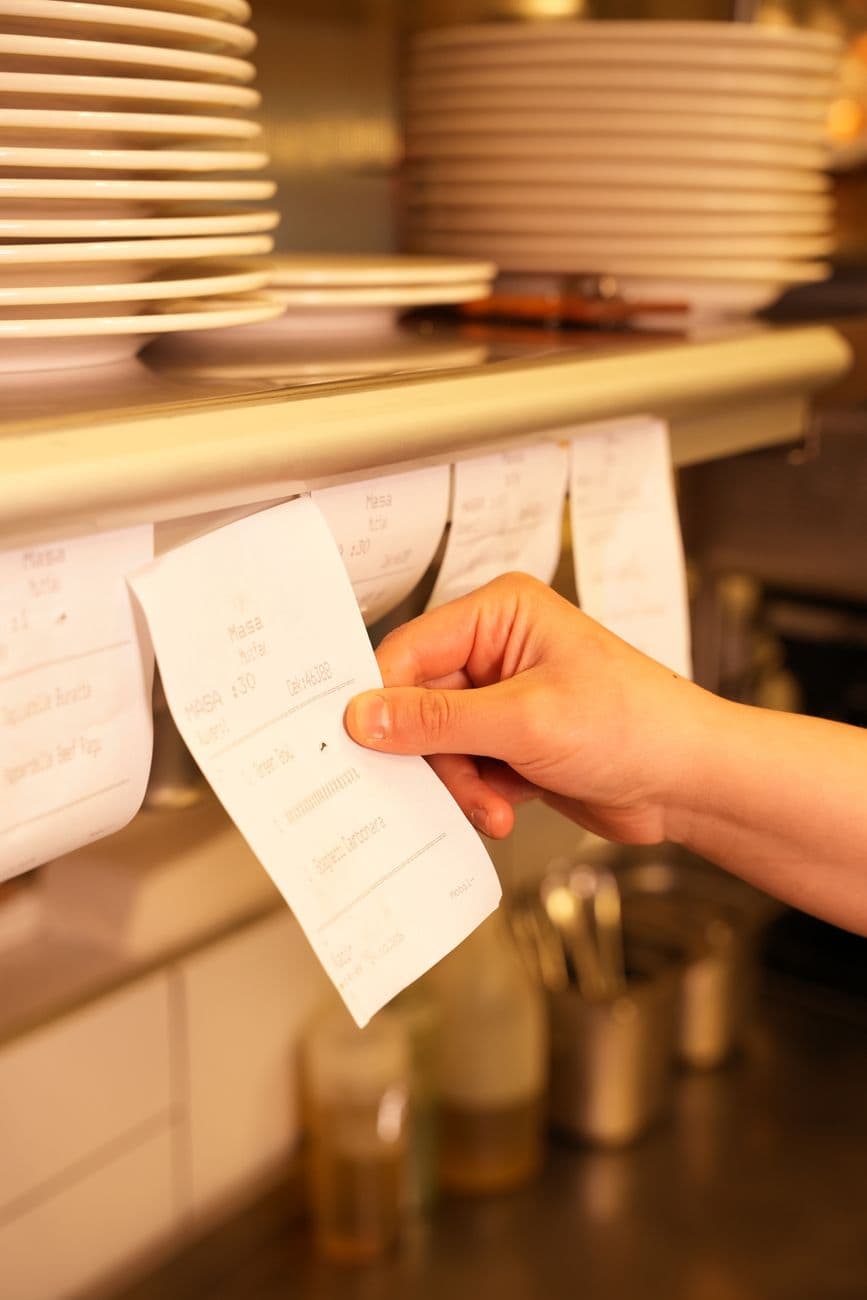
A hand pulling order tickets in a busy kitchen

Staffing signal

Revenue by hour set against who was on, which is the same data your schedule should be built from.

WHAT YOU SEE

Your dashboard, not a template.

Five builds, five businesses, five different screens. We do not ship one layout with your logo on it — the measures, the density and the look all follow how you actually run, which is why none of these resemble each other.

app.aurorapos.io/venue/9812
LIVE
aurora

Evening service

Venue 9812 · vs 4-week average

SalesLaborMenuForecast
Recommended

Drop two bar shifts on Tuesday and Wednesday.

Bar covers are down 14% on those nights only. Kitchen covers are flat, so the sales are not moving elsewhere.

+$780 / wk

Revenue

$58.4k

+6.1% vs fcst

Covers

1,523

-3.4% vs fcst

Avg spend

$38.4

+$2.10

Prime cost

61%

3.0pt over

Revenue through service

peak 19:00 · $8,970

Food 33.2%Labor 27.8%3.0pt over target

Needs a decision

Section 12–16 turning 22% slower after 20:00 since the 6 Sep layout change.

≈ 9 covers a night

Set menu lifted average spend $2.10 without hurting covers.

+$1,340 / week

Aurora · Neon violet · modern SaaS

1 / 5

Example builds · illustrative figures, not a client's data

THE MATH

1% of your sales is worth more than we charge.

Move the slider to what you sell in a month. If better numbers help you save or earn just 1% more, that is the middle figure — and the one on the right is what the reporting costs.

01What you sell

$80,000

a month

$10k$500k

021% of that

$800

a month

$9,600

a year

03What we charge

$99

a month

8.1×

what we charge each month

Tier 1, one location. The other tiers are priced further down the page.

We are not promising you that 1%. We are showing you how big it is, and what it costs to see where it is hiding.

PRICING

Three tiers.

Setup covers the build and the connection to your POS. The monthly covers hosting, the connection staying up, and the repairs nobody can schedule in advance.

Tier 1 — Standard

One location, the standard measure set.

$99 to $149 / mo

$1,000 to $1,500 setup

Includes

  • Sales by day and daypart
  • Revenue by hour
  • Item and category mix
  • Payment type breakdown
  • Employee sales
  • Order type split

Tier 2 — Custom Metrics

One location, with the logic your business actually runs on.

$199 to $299 / mo

$2,000 to $3,500 setup

Everything in Tier 1, plus

  • Labor cost as a percentage of sales by daypart
  • Prime cost
  • Item-level margin against your entered costs
  • Tip pool and distribution logic
  • Custom key performance indicator (KPI) definitions
  • Scheduled email or WhatsApp reports

Tier 3 — Multi-Location

Two to five sites, read as one business.

$150 to $250 / site / mo

$3,500 to $6,000 setup

Everything in Tier 2, plus

  • Cross-location roll-up
  • Site-versus-site benchmarking
  • Group-level profit and loss view
  • Per-site user permissions
  • Consolidated exports

Add-ons

Additional data source — accounting, scheduling, delivery apps$400 to $900 setup
Additional location beyond five$500 setup · $125 / mo
Partner-gated POS onboarding$500 to $1,500 setup
New report or measure after launch$250 to $600
Development and consulting$120 to $150 / hour
Annual prepayTwo months free

Sales reporting tells you what left the kitchen. It takes a second system to tell you what it cost to put it there.

/ practice note · compass-its
COVERAGE

Twenty-two platforms, and a way in for most of the rest.

Connect directly

Inside the standard tiers

  • Square
  • Clover
  • Lightspeed Retail
  • Lightspeed Restaurant
  • Shopify POS
  • Revel Systems
  • Epos Now
  • Loyverse
  • Zettle by PayPal
  • SumUp
  • Erply
  • Odoo POS

Vendor approval required

Onboarding fee · two to six weeks

  • Toast
  • SpotOn
  • TouchBistro
  • PAR Brink
  • Oracle Simphony
  • Oracle MICROS
  • NCR Voyix and Aloha
  • Lavu
  • GoTab
  • Heartland Restaurant

Running something else? If it exports on a schedule or holds its data somewhere we can reach, we can usually work with it. Ask, and we'll tell you either way.

WHY US

Built by people who read profit and loss statements.

A finance degree from Portland State, financial reporting for an Oregon senior living operator, and a stretch at the Port of Portland — then a technology firm. The reports come from someone who has had to explain a variance to a board, not from a template.

  • We build the report we would want to read, which is not the one the POS ships with.
  • Our build team runs nine hours ahead of Oregon. You send a change at the end of service, and it is usually waiting when you open.
  • That is also why this costs less than a US agency for the same output, and we would rather say so here than have you find out later.
  • Point-of-sale vendors change their plans and their interfaces. When a report stops running, fixing it is our job, not yours.
START HERE

Tell us what you run.

Tell us which POS you run and how many locations. That is enough for us to say whether this works for you.